ViPER-GT in Depth
We are glad to present this User's Manual for ViPER-GT. We have prepared a Tutorial as a separate document to give the ViPER users a quick-start on using our software.
This document is divided into five parts. In the first part, we describe the specifics of the user interface and different controls for annotating the video or input image. The second part desscribes how the user interface can be used to open a video and editing the descriptors.The third part will explain about the types of attributes that can be used to annotate the video and how to draw and edit those attributes. The fourth part describes the theory behind different operations like propagation and interpolation. The last part describes how to use the schema editor to create and edit descriptors.
The appendix describes the terminology we have used in this manual and definitions of key terms.
User Interface Specifics
|
| Fig.1 Complete GUI with an annotated video |
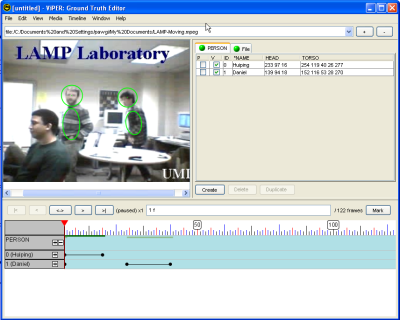
The above figure shows how the user interface will look when you will annotate a video. We can clearly see the following regions in the interface.
- Menubar: The menubar contains menu controls for opening and annotating a video, the zooming operations, creating descriptors and setting their attributes and a Help Menu.
- Canvas: Canvas is the portion of the image that displays the video or image frames. It supports zooming and panning operations on the video.
- Spreadsheet View: Spreadsheet contains a tabluar display of the descriptors and their attributes. You can edit the attributes on the spreadsheet view.
- Timeline View: The timeline view is beneath the Canvas and the Spreadsheet view. It contains a Remote Control Panel to navigate the video. It also contains a Timeline panel. The Timeline panel contains the descriptors and their validity lines. The validity lines tell the user in which frames the descriptors are valid.
Menu Bar
File
- New Metadata
- Clears the currently loaded metadata file.
- Open Existing Metadata...
- Opens a dialog window that allows a user to select a metadata (ground truth xml) file.
- Save Metadata
- Saves the currently open metadata.
- Save As...
- Opens a dialog window that allows user to select the directory and the name of the file to which the metadata is to be saved.
- Import Schema...
- Imports a schema from an existing metadata file. It also supports the old metadata format.
- Import GTF File...
- Imports data in the old (non-xml) viper data format. That only described one file at a time; it imports the data to describe the currently selected video.
- Export as GTF File...
- Exports the metadata for the currently selected video in the old data format.
- Recently used file
- This sub-section displays a list of recently opened files. The user can reopen a recently used file from this list.
- Exit
- Exits the viper annotation tool.
Edit
- Undo
- Undoes the most recently done operation. It keeps a log of the recently done operations and the user can undo them.
- Redo
- Redoes the undone operation.
View
- Toggle display of invalid descriptors
- Toggles between displaying only valid descriptors and all descriptors.
- Zoom in
- Zooms in the video by 2x
- Zoom out
- Zooms out the video by (1/2)x
- Previous Zoom
- Zooms the video to the scale of the last zoom operation.
- Next Zoom
- Zooms the video to the scale of the next of the previous zoom.
- Actual Size
- Sets the zoom of the video to actual size.
- Zoom to Fit
- Scales the video so that it fits inside the current video frame view.
Media
- Add Media File
- Adds a new video to the current metadata. Equivalent to the '+' button next to the video selection pulldown menu.
- Add directory as a single file
- The user can add all the image files in a directory and perform ground truthing on them.
- Remove Current Media File
- Removes the currently displayed video, and all of its metadata, from the current metadata file. Equivalent to the '-' button next to the video selection pulldown menu.
Timeline
- Fit to Window
- Scales the timeline's width so that it fits inside the view.
- Expand All
- Expands all the nodes of the timeline.
- Remove All Markers
- Removes all user marks set on the timeline.
Window
- Show Undo History
- Displays the undo history window.
- Show Media Files
- Displays a window containing a list view of the media files. It may be of more use than the pulldown for large numbers of files.
- Show Schema Editor
- Displays the schema editor.
Help
- Display HotKey Bindings
- This sub-menu will pop-up a window describing all the hotkey combinations that the user can use to control viewing of the video.
- About
- Displays version information about the software.
Canvas
The canvas displays the image corresponding to the current frame of the video. The panel is also used to draw, select and edit shape attributes via mouse motions and clicks.
Spreadsheet View
The Data Panel contains a spreadsheet representation of the metadata. It consists of one tab containing all of the content descriptors and an arbitrary number of object descriptor tabs, corresponding to each object descriptor type in the GTF configuration.
Each object descriptor tab has a round button that can be either in red or green states: the visibility ball. When the visibility ball is green, all of the shape attributes of the object descriptor are drawn in the canvas, but when the button is red, the attributes are not drawn.
Each object descriptor tab has a table that contains the information for all objects of this kind. Each row of the table represents an instance of the type whose name is in the tab, while each column (after the first three) represents an attribute. The left-most column labeled P is the propagate column, and contains a check box for each descriptor instance. The second column from the left, labeled V, shows if the object is valid for the current frame; only objects valid for the current frame can be edited. Checking the V-column for an object whose attributes already have values for other frames sets all the values to null for the current frame. Note that if a descriptor is set as invalid for all frames it will not be saved. The last non-attribute column in the object tabs is the OBJECT ID column. The object identification number is unique to each instance of a given object descriptor type. It is not necessarily sequential and not all numbers may be present.
Each object descriptor tab has Create
, Duplicate
and
a Delete
button. The Create
creates a new object
valid for current frame, with all attributes initialized to null. The Duplicate
button creates a copy of the selected
descriptor with a different object ID. The Delete
button removes the selected row from the table.
The user can edit the attribute values by clicking the cells in the spreadsheet view and typing new values. Spatial attributes can also be drawn on the canvas, after being selected in the table. Refer to the appropriate sections described above for more information.
Timeline View
The Timeline View consists of two sub-panels. The Remote Control Panel and the Timeline Panel.
Remote Control Panel
The remote control panel has following components to navigate the video. When a given frame is chosen using the Current Frame field, the frame's image is loaded into the canvas and the now-current shape attributes are drawn in the canvas.
- Skip back a section
- Click on this button to go back to the beginning i.e. the first frame of the video.
- Previous Frame
- This button takes the user to the previous frame in the currently playing video. While the video is playing, this button changes its state and display a '-' sign. It indicates that the user can click on it to decrease the rate at which the video is playing.
- Playback/Pause Toggle Button
- This button is used to play the video while either in paused state or in stopped state. While the video is playing, the button changes the icon to the Pause control.
- Next Frame
- This button takes the user to the next frame of the currently playing video. While the video is playing, this button changes its state and displays a '+' sign. It indicates that the user can click on it to increase the rate at which the video is playing.
- Skip ahead a section
- Click on this button to go to the end i.e. the last frame of the video.
- Current Frame
- This text field displays the currently playing frame number.
- Mark
- This button is used to set marks on the timeline while the video is playing or is in the paused state. These marks can later be used to go to a specific frame.
Timeline Panel
The Timeline panel lists the descriptors on the left side. On the right side, it displays a frame-scale. The frame scale is divided into the number of frames contained in the video. It also displays the red colored timeline cursor. For each descriptor, there is a validity segment(or segments) that stretches between the frames the particular descriptor is valid. For a better explanation a figure of the timeline view is given below.
 |
| Fig. 2 The Timeline View shows the Remote Control Panel at the top and the Timeline panel beneath it. |
As you can see, the timeline view shows the Remote Control Panel at the top with the buttons and the frame control field. Beneath this panel is the Timeline Panel. The left side of the timeline panel shows the descriptors in the video and their descriptor type. The right side shows the timeline divided into frames, the red-colored cursor and the validity segments beside each descriptor instance ending with a solid circle. The span of the thin green lines (beneath the timeline) and the validity segments indicate the frames in which the corresponding descriptors are valid.
Performing operations on the user interface
Input/Output
ViPER-GT takes two kinds of data as input: video data for the author to describe, such as an .mpeg video and ground truth files which describe the video.
Creating a New Metadata File
To create a new, empty metadata file, use the dialog window that
appears when you select File >> New Metadata menu item.
Opening Existing Metadata File
To open a metadata file, use the dialog window that appears when
you
select File >> Open
Existing Metadata menu item.
Adding a New Video and Removing a video
You can notice a '+' button beneath the menubar. Click on that button to open a FileChooser dialog box. You can add a new video in the pull-down menu using this control. Use the '-' button beside it in similiar fashion to remove a video file. You can do the same operations using the menu Media >> Add Media File and Media >> Remove Media File.
Navigating Video
ViPER-GT has several GUI controls for traversing the video and accessing specific frames. These controls are all located beneath the video frame and spreadsheet views, in the Timeline View. They can be used either through the timeline panel or the remote panel. Note that with any temporal navigation in a video, all descriptors that are marked for value propagation will copy their value for all frames between the previous frame and the new one, inclusive.
Also, note that the video canvas is zoomable , meaning that you can use the mouse scroll wheel to zoom in and out of the image, offering you more control over the way you edit the data. However, in this section we will focus on temporal navigation.
Selecting a Frame Number
Type the desired frame number into the text field, Current Frame located next to the play/jog control button and press Enter to make the frame typed in appear as the current frame on the canvas.
Dragging the cursor along the timeline
There is a red current frame marker (cursor) in the timeline panel which indicates which frame in the video is currently displayed on the canvas . You can drag the marker directly in the timeline view to scrub through the video.
It is also possible to jump to any marks you have currently set in the timeline, by right-clicking on the mark and selecting 'Go to Mark'.
Frame Advance and Retreat
Click on button labeled '>' to
increment the current frame by 1. Click on button labeled '<' to decrement the current frame by 1. Note
that, using the '+' and '-' controls on remote, the speed of playing
the video can be incrased and decreased. But the Frame Advance and
Retreat will still increment and decrement the current frame by 1.
Playback
What would we have without the ability to play the video? The '<->/#' button toggles between playback and paused states. In playback, the two adjacent buttons become speed controls, instead of Frame Advance and Retreat button.
Using 'Display with Respect to'
This feature can be used with reference to a spatial attribute. Select a spatial attribute in the spreadsheet view. Right-click on it and select the option 'Display with Respect to'. You can observe that this attribute is marked in yellow on the canvas. Now when you play the video, the frame is moved in such a way so as to always keep this attribute in centre. Note that to use this feature, the descriptor must be valid in that frame and the value of the attribute must not be NULL.
Play Where Valid Feature
Click in the square beside a descriptor in the Timeline Panel. You can see a white circle covered by red outline. Now when you will play the video; it will only playback those frames where this descriptor is valid.
Hotkeys
A variety of hotkeys, including the notable 'p' key, which toggles between paused and play states, are useful in quickly navigating the video while keeping both hands on the keyboard. For more information, see the hotkey list in the 'Help' menu.
Editing Descriptors
Modifying a Descriptor
Modification of an object’s attributes is described in detail in the following sections. However, most attributes may be edited directly in the spreadsheet view, which contains content descriptors, in the first tab if any exist, and object descriptors in the tabs to the right/beneath the first tab. Editing the descriptors is as editing elements in a spreadsheet.
Note that content and object descriptors both contain two columns,
labeled P and V.
The P checkbox is used for propagation and
interpolation, described below. The V
checkbox is for validity, indicating that the descriptor appears on or
has meaning for the current frame. For example, a Transition content
descriptor is only valid for frames that represent a cut or fade, and
its V checkbox should be unfilled for all
other frames.
Further, note that object descriptors have an OBJECT ID column. This column is not
editable, but generated automatically. Also note the visibility ball
next to the descriptor type names in the tabs. When this is red, the
attributes are hidden and unable to be selected. Clicking the ball
toggles between visible (green) and invisible (red). Object descriptor
attributes may be either static or dynamic; static attributes have an
asterisk before their names in the column headings, and can only take
one value for the life of a descriptor, but dynamic attributes can have
a different value for each frame the containing object descriptor is
valid.
Adding Object Descriptors
To create a new object with all attributes initialized to NULL, press the Create
button on the appropriate object descriptor type tab. For example, to
create a new FACE(assuming your schema
defines a FACE object descriptor), click the
FACE
tab and click Create
.
Duplicating an Object Descriptor
To copy an object descriptor, select the source by clicking in the
appropriate cell of the OBJECT ID
column and click the Duplicate
button at the
bottom of the spreadsheet view.
Deleting an Object Descriptor
To delete an object, first click on its cell in the OBJECT ID
column, and then
click the Delete
button.
Attributes
The attributes are divided into two categories: text (string based) and spatial (shapes). Text attributes can only be edited in the data table, while shapes can also be edited in the canvas. Before editing an attribute, make sure that the object whose attribute is being edited is valid for the current frame; that is to say, make sure that the “V” column checkbox is checked for the descriptor whose attribute you wish to edit.
Text Attributes
Text attribute types include bvalues, dvalues, fvalues, svalues and lvalues. To edit text attributes, except lvalue and bvalue, select the attribute in the data table with a click in its cell. A single click selects the cell for editing and places the cursor at the end of the current text, while a double-click selects a word in the cell and a triple-click selects all the text in the cell. The appropriate value may be typed with the keyboard. Lvalue attributes offer a pull-down list instead of a text box, and can be edited with the mouse alone.
Spatial Attributes
Spatial attributes, which in the current version are all shapes, are attributes that can be drawn and manipulated in the canvas. Spatial attribute types include bboxes, oboxes, ellipses, open and closed polygons, points and circles.
A spatial attribute goes through two phases. Initially, a spatial attribute must be created. This creation is typically started by clicking on a cell with NULL, and making sure the Valid checkbox is selected. Once the shape has been drawn, it enters a second phase, where it can be edited. Spatial attributes can be edited in one of the two ways. You can either modify the values in the spreadsheet view, or edit in the frame view. It is usually easier to edit in the frame view, where there is GUI support for manipulation.
Mainpulation of spatial attributes requires knowing when one is in creational mode or in editing mode. Creational mode occurs when a valid, NULL spatial attribute has been selected on the spreadsheet view, or when a frame changes, and the highlighted spatial attribute is NULL. The following sections describe the spatial attributes and how to use the mouse to create each of them.
A Description of Spatial Attributes
The following describes each of the spatial attributes:
bbox
The bbox is a non-oriented rectangle shape. It can only be
positioned
with the sides parallel to the axis of canvas. The
string representation of a bbox, used in the spreadsheet view, is x
y h w where x and y are the coordinates of the
top-left corner of the box, h is the height and w is the
width. Remember that the coordinates of the image count
down and to the right from the top left corner.
obox
The obox is the oriented rectangle. It offers the features of the
bbox,
with the addition of
a fifth number, the orientation. The string representation of an obox
is x y h w o
where x and y are coordinates of the top-left corner of the box, h is
the
height, w is the width and
o is the orientation (angle) in degrees counter-clockwise.
ellipse
The ellipse shape acts exactly like an obox. Its string representation is the same as the string representation of an obox that bounds the ellipse.
point
A point’s string representation is x y where x and
y are the coordinates of the point.
circle
A circle is defined by its center and radius. The string
representation is x y r, where x and y are the center
point’s coordinates,
and r is the radius.
polygon
A polygon is an ordered list of points, with line segments
connecting them. Closed polygons have a line segment connecting the
first and the last point, while open polygons do not. The
string representation for both is: (x1 y1)(x2 y2)... (xn yn)
where x1, y1, x2, y2, ..., xn, yn are the coordinates of
points of the polygon. Note that open polygons must have at least two
points and closed polygons must have at least three. Currently, only
closed polygons are supported.
Creating Spatial Attributes in the Canvas
Convention
- To press a button means to click the left mouse button, but not release it.
- To drag means to move the mouse while a mouse button is pressed
- To release means to stop moving the mouse and release the button
- To click means to press and release the left mouse button quickly
We assume a standard two button mouse with scroll-wheel.
To create a new spatial attribute, click on a spatial attribute that is NULL in the spreadsheet view. Make sure the attribute is valid in the frame. Then, follow the directions below. Once the shape has been created on the canvas, you go into editing mode, which is described in the next section.
bbox
To create a bbox, press the mouse button down. This will set one of the corner points of the bbox. Drag the mouse. When the mouse button is released, this defines the other corner point of the bbox.
obox
Creating an obox is done in two phases. The first phase is drawing the top edge of the obox. (The top edge may not always be the literal top edge. It may appear to be the bottom edge or a side, but is treated as the top edge.). Click the mouse without releasing. This defines the upper left corner. Drag the mouse and release. The point at which the mouse is released is the upper right hand corner. This is the width of the obox
When released, a short line is drawn from upper right corner "down". This defines the direction in which the obox must be drawn (thus, oboxes have orientation). Click the mouse and drag, and the rest of the obox is drawn. Release when the desired height of the obox is obtained.
ellipse
An ellipse is oriented, just like the obox. The editing controls are identical to the obox. The obox defines the boundary of the ellipse. There are two phases. The first phase draws the top edge. The second phase picks the height.
point
Press the mouse, and release. The point at which the mouse is released defines the coordinates of the point.
circle
Press the mouse, but don't release. This defines the center of the circle. Drag the mouse to define the radius of the circle. The radius of the circle is set to the point at which the mouse button is released.
polygon
Click the mouse to define an initial point. Each click of the mouse defines the next point in the polygon. A line is drawn from the previously clicked point to the point at which the mouse is hovering. Clicking it adds a point and completes an edge. Repeat this procedure to draw the subsequent edges. Click Enter to complete the closed polygon. This draws a line from the last drawn point to the initial point. Currently, only closed polygons are supported.
Selecting Spatial Values in the Canvas
To select an existing value, you can click on it in the canvas. If more than one value are in the same place, for example, if one box is inside another, hold down control while clicking to cycle through the different values. You should notice the color of the box changing from the unselected color (green) to the selected color (red), while the descriptor for the given attribute is highlighted and displayed in the table.
Drawing and Editing
You may create and edit shapes in the frame view and the spreadsheet view. To draw or edit shapes in the data panel, select the cell for the attribute and descriptor you wish to edit, and then type an appropriate value for the data type as described below. Procedures for drawing shapes using frame view are unique for each shape; these are described for each shape below, as well. In order to start drawing, click on the 'Null' attribute to select it, then edit it as described below.
bbox
If a bbox is selected (it is in red), you can move the mouse over the edge, corner, or interior of the bbox. If the cursor is near a corner, a circle is drawn, indicating that you can drag that corner to resize the bbox. Releasing the mouse resizes the bbox. If the cursor is near an edge, the edge is highlighted (becomes thicker, and colored in magenta). You can drag that edge. Dragging an edges preserves height or width depending on which edge is dragged. If the cursor is inside the bbox, all four sides are highlighted. If you drag the mouse, it translates the entire bbox.
Press the Delete button to remove the box.
obox
Resizing, moving and deleting procedures for obox are the same as those for bbox. You can change the orientation by moving the mouse over the tiny yellow "bar" which is usually the upper right hand corner. Press and drag this to rotate the obox.
Remember that the orientation of an obox is likely to be important during evaluation, and the user should probably make sure that the box is oriented so its content is rightside up.
ellipse
Editing an ellipse is just like editing an obox. The ellipse is shown when it is edited, which allows one to distinguish between editing an ellipse and editing an obox.
point
You can only drag a point. Move the cursor near the point, and press. Then, drag the ppint to a desired destination. When the point is at the desired location, release the mouse. To delete a point, hit the Delete button.
circle
If you move the cursor inside a selected circle, and then press the mouse button and drag, you should move the entire circle. If the cursor is near the edge of the circle, a radius appears, which means you can resize the circle without changing the center point. To delete the selected circle, click on the Delete button.
polygon
Moving the cursor to various parts of a polygon allows different choices of editing. If the cursor is moved near a corner, then a circle is drawn at the corner. Press the mouse button and drag to move the corner. If the cursor is near an edge, the edge is highlighted. Pressing and dragging moves the highlighted edge. If the cursor is in the interior of the polygon but not near an edge or corner, then all edges are highlighted. Pressing and dragging the mouse moves the entire polygon.
If you press the ALT key and move the mouse near the polygon, a bounding box is drawn. You can move the cursor near a corner, and a circle is drawn. If you press and drag near a corner, this resizes the polygon. If the cursor is near the edge, the edge is highlighted. Dragging and pressing the mouse moves the edge of the bounding box which also resize the polygon. Resizing leaves the "center" of the polygon (the center of the bounding box, actually) unchanged.
Advanced Operations: Propagation and Interpolation
Overview
ViPER-GT allows users to perform two operations on values of attributes of selected object descriptors over a range of frames. The operations are propagation and interpolation. It is possible to invoke these operations directly from the table by right-clicking on the descriptor, or through the timeline by dragging from one place to another.
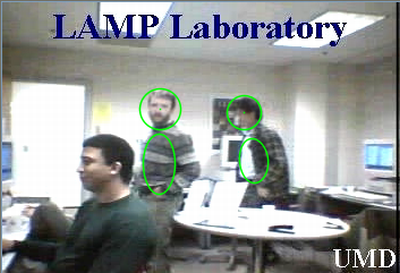
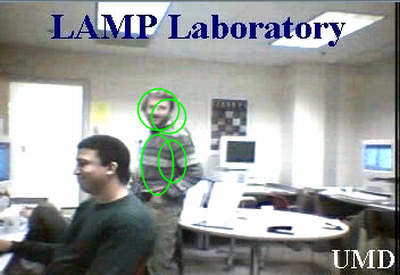
Consider the following figures. We have created two descriptor instances. We have marked 'head' and 'torso' for both of them. To demonstrate the effect of propagation and interpolation, we propagate the attribute values of one descriptor instance while we interpolate the attribute values of another instance. The screenshots depict the changes in the location of the attributes that were interpolated while the attributes that were propagated keep the same value throughout all the frames.
 |
| Fig. 3 One descriptor has the attributes set to propagate and one has them set to interpolate. Initial frame, before playing the video. |
 |
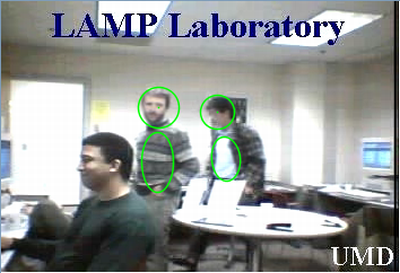 |
| Fig. 4a The location of the spatial attributes in Frame 10. | Fig. 4b Frame 20. One set of attributes, set to interpolate, is moving with the descriptor while the other, set to propagete, is at the original location. |
 |
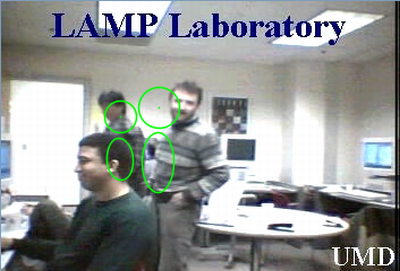 |
| Fig. 4c Frame 40. We can clearly observe the interpolated attributes changing location. | Fig. 4d Frame 60. The descriptor whose attributes were set to be propagated, has changed its location. But the attributes are still at the original location. |
Propagation in Detail
Propagation copies the current frame’s value of selected object descriptors to all frames in the range of propagation. All values of the chosen object descriptors are overridden with the values in the current frame.
To propagate the value of a descriptor, go to the frame that contains the value you want to copy. Check the checkboxes in the “P” column for the descriptor or descriptors you wish to propagate. Then you can play the video or drag the cursor till the desired end frame for propagation. The second option is simply to change frames incrementally. All the frames between the current frame and the frame you change to will take the current value of all descriptors marked for propagation.
Be careful! Once you have checked the box, it remains checked until you uncheck it or quit the program; changing the tab is not enough, as you may wish to propagate or interpolate two different types of descriptors at once. This is important, as one of the easiest, and most dangerous, ways to propagate a value is simply to leave propagate checked and go through a file a frame at a time; if you decide to go a hundred frames back, but forget to save and uncheck propagate first, you can easily erase a hundred frames of work.
Interpolation In Detail
Interpolation fills in intermediate values of spatial attributes with the given end values as shown in the above figures. All values of all spatial attributes of all chosen object descriptors for all frames in the open range are overridden with the values generated by interpolation algorithm. To interpolate objects follow these steps:
- Draw the spatial attribute(s) that you want to interpolate on the start frame for interpolation.
- Go to the frame that should be your end frame for interpolation and draw the corresponding spatial attribute.
- Go back to the starting frame for interpolation.
- Select object(s) to be interpolated and Right click in the object(s)'s cell.
- Click on the Interpolate button. Enter the number of end frame that you want to interpolate the attribute to.
- Uncheck the P-column of all interpolated objects. This step is important, because objects marked for propagation will be propagated when you go to another frame, possibly overriding needed data.
To interpolate up to a mark, follow the procedure described above. But instead of the end frame number, you have to consider the mark as the end point for interpolation. Draw the attribute on the frame corresponding to the mark upto which you want to interpolate. Then go back to the start frame. Right click in the cell of the corresponding object descriptor and select Interpolate to Mark. This option will list the number of marks present on the timeline. From this options select the proper mark to interpolate. If no mark is present on the timeline, this option will be disabled.
Note:You can mark the frames in a video by clicking the Mark button on the Remote Control Panel when the timeline cursor is in the desired frame.
Using the Schema Editor
Creating a new descriptor and attributes
The schema editor is used to create new descriptor types and add attributes to them. You can also specify the properties of the attributes and edit and delete the attributes. To use the schema editor, go to the menu Window >> Show Schema Editor. To create a new descriptor, click on the button Add Descriptor. This will add a new descriptor of OBJECT type to the configuration as shown in the following figure.
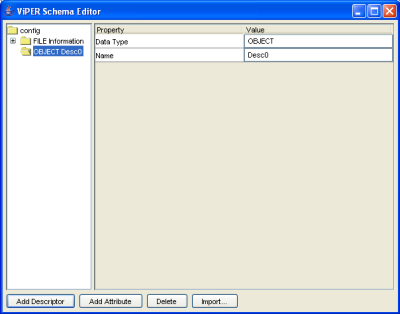 |
| Fig. 5a Creating a new OBJECT descriptor using the schema editor. |
You can always change the type of the descriptor by clicking in the Data Type field and then choosing either the FILE or the CONTENT as the descriptor type. Now lets name the descriptor as PERSON and add some attributes to it. Click the Add Attribute button and add a new attribute NAME. We will make the type as svalue, dynamic property as false and set the initial value to be NULL. The schema editor now looks like this.
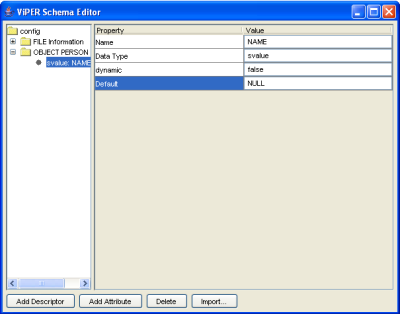 |
| Fig. 5b Adding an attribute to the descriptor. |
In a similar way, we will create two spatial attributes namely HEAD and TORSO. We will set the type of HEAD as circle and that of the TORSO as ellispse. Their dynamic property will be set to true and the initial values will be set to NULL.
Deleting and Editing Attributes and Descriptors
You can delete an attribute by selecting it from the 'config' tree view on the left and clicking the 'delete' button. You can also delete a descriptor by selecting it from the tree view on left side and clicking the 'Delete' button on the interface. To edit an attribute, simply click in the cell of the specific attribute and change the value.
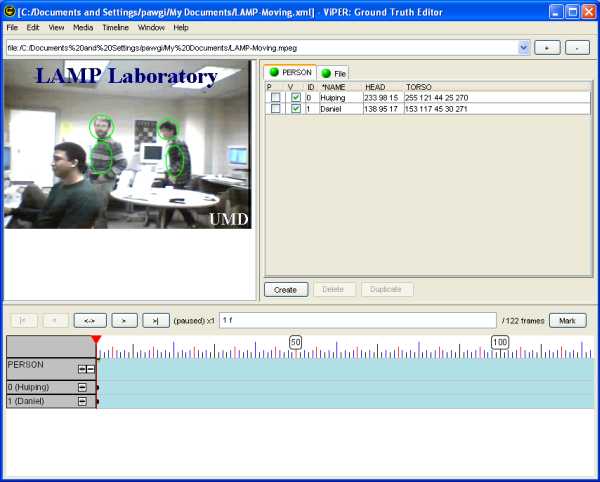
After creating the descriptors and the attributes, you can now go back to the main application window. Using the Spreadsheet View, you can create new descriptor instances. For example we have created two instances on the descriptor PERSON. We have also marked their spatial attributes on the canvas. The following figure shows the created descriptor instances and their spatial attributes. We have used the canvas to draw the spatial attributes. The drawing of spatial attributes is described in the section Attributes.
|
| .Fig. 5c Creating new descriptor instances and their spatial attributes using the Spreadsheet View and the Canvas. |
Appendix
Terminology
- Candidate data
- Also known as result data, this is the set of descriptors generated by some algorithm that will be compared to the target data
- Detection
- An object is classified as
Detected
if one of its type is found on the frame. For example, if you want to retrieve all the frames containing faces, you may find thatDetection
is the only required depth of analysis. - GTF
- Ground truth file. This is a file containing ViPER metadata, and need not refer to truth but sometimes refers to software generated or otherwise untrustworthy metadata.
- RDF
- Result data file. This is ViPER metadata that was algorithmically generated.
- Results data
- See Candidate data
- ROP
- Ranged Operations Panel. This was located beneath the main canvas in ViPER-GT version 3; it included user interface controls for propagation and interpolation. It has since been replaced by the timeline control.
- RSB
- Range Selector Bar. Graphical element, found in ViPER-GT version 3, that was used for selecting the range of interpolation or propagation. In ViPER-GT version 4, this is accomplished using marks on the timeline.
- Target data
- Also known as truth data, this is the set of descriptors that represent the true content of the media file
- Timeline
- This panel provides an overview of an entire clip, and some editing functionality.
- Truth data
- See Target data.
- Visibility ball
- The green or red ball in each tab of the data panel. Set to green indicates that the shapes are visible in the canvas, while red means that the shapes are to be invisible and unable to be selected.
Attribute Data Types
- bbox
- A bounding box; it is a rectangle on the image.
- bvalue
- A Boolean value: either
trueorfalse. - circle
- A circle, in terms of center point and radius.
- ellipse
- An ellipse, in terms of its bounding box.
- fvalue
- A floating point number.
- lvalue
- An enumeration type. Its configuration must take a list of
possible values. In the gtf format, this is done with a bracketed list,
eg [LEFT RIGHT]. In the xml format, the
attributeelement must have adata:lvalue-possibleschild, which in turn has adata:lvalue-enumelement for each value, where the value is specified in thevalue
xml-attribute of the element. - obox
- An oriented bounding box.
- point
- Some specific pixel in the image.
- polygon
- A polygon or polyline, given as a list of points.
- relation
- A set of object identification numbers to a certain type of descriptor.
- svalue
- A string value. Remember that strings must be xml-escaped in the XML format.
Apploader Properties
Starting with ViPER-GT 4, we are using an RDF document (or two) to
describe the user preferences, and, to a large extent, the application
itself. If you have the full version, the RDF is in a
file in the gt/CONFIG/gt-config.n3 file. N3, or Notation-3 , is a
format for writing a superset of RDF, although the current parser only
accepts valid RDF, failing on n3's formulae (things enclosed in curly
braces). See also Dave
Beckett's parser for the same subset of n3.
The different schema used by the program should be documented on the web site. The file is used both to describe the application and to generate documentation for it, including error messages and help text. Not all features are complete yet.
You should read the file to get the most up-to-date information about preferences, at least until this list is automaticlly generated from the file. For hotkey information, look for the hotkeys: prefix.
FAQ/Trouble Shooting
The timeline is not expanding to fill the window.
ViPER-GT requires at least version 1.4.2 of java. Go to http://java.sun.com/ to download the latest version (or, for Apple users, use Mac OS X's Software Update feature).
1 The term “video” is used in this manual to refer to visual data (as opposed to GT data) loaded into Viper. It may be either an ordered sequence of images defined by an info file or a video file.

